COVID-19 Bulletin No 2
This Bulletin presents the basic data for infections and deaths from the Covid-19 for the six Eastern Partnership (EaP) states in the international context, based mainly on the data base maintained in real time at John Hopkins University.
The summary picture for the EaP states, as also for the Balkans, is one of very low infection and death rates so far. However these states are time-lagged behind Italy by as much as one month. Looking at the pattern of dynamics emerging, whereas Italy has now passed it peak after 6 weeks, the EaP and Balkan states may be expected to see big increases in infections maybe by as many as five to ten times over the next two crucial weeks.
As between the six EaP states, the lowest infection level and rate of increase is found in Georgia, which took very early and strong action. Very low per capita infection rates are also seen in Ukraine and Belarus (as in Russia too), but here the current rates of increase are much faster. The infection rates are higher in Moldova (big diaspora in Italy) and Armenia (proximity to Iran). The infection rate remains very low in Azerbaijan, but rises quite fast.
On the other hand the economic and social impact for the EaP and Balkan states are already much more severe. The extent of lock-downs and losses of economic output, employment and incomes seem to be comparable to that in Western Europe, but the levels of income and financial reserves of the population so much less, as also the fiscal capacity of the state to take compensating measures.
Infections
While varying testing rates can distort comparisons of infection rates substantially, by 5 April 2020 the cumulated number of recorded infections had roughly stabilised in China at a little over 80,000, whereas it was still rising fast in the United States beyond 300,000 and a large sample of seven West Europe states with over 500,000 (Table 1). By comparison both Eastern and South Eastern Europe were little hit so far with under 4,000 each for the six Eastern Partnership (EaP) states and five Balkan states.
The pattern is valid also on a per capita basis. Whereas in China the infection rate rose to one in 16,758, in Europe per capita infections are now hugely higher, ranging from one in 370 of the population (Spain, now exceeding even Italy), to one in 861 (Germany), followed by one in 1,052 in the US. The EaP aggregate stands at one in 18,437, Russia at one in 30,754 and the Balkans at one in 6,121. The Chinese and Russian data are strictly controlled by the authorities, and the statistical quality may be affected.
But see the reservation noted below on the relatively low level of testing in these countries, most notably implying under-representation of infection rates in Georgia and especially Ukraine.
Deaths
The pattern of deaths is somewhat different partly due to varying adequacy of testing. But time lags and the quality of health care are also factors. Western Europe has seen by far the biggest number of deaths with 42,304 in the large sample of seven states, followed by 8,407 in the US, 3,300 in China and very small numbers in Eastern and South Eastern Europe (Table 2).
On a per capita basis Western Europe has seen 50 times as many deaths per capita than China, and 5 times as many as the US, whereas for Eastern and South Eastern Europe the deaths per capita are closer to that of China.
Testing
The average rate of testing by the seven West European states has been 6,575 per million population, which may represents a high standard. Outliers with outstandingly high include Italy (11,436, the highest recorded), followed by Germany (10,982). Lower than average are Sweden (3,654), France (3,430) and lowest UK (2,880).
The US and Russia are both a little under the above average (5,344 and 5,194 respectively). The EaP and Balkan states are both on average much lower, at 2,137 and 1,724 respectively. However within the EaP six there are marked divergencies, with Belarus and Azerbaijan recording relatively high rates of testing (4,233 and 3,945), while Georgia is much lower (692) and Ukraine by far the outstandingly lowest at 134.
Taking this data into account one may suspect the following biases in the recorded infection rates:
-
The highest test levels presumably mean the most adequate infection data, thus for Italy and Germany, with Spain, Belgium and the US also at a relatively sound level.
-
Among West Europeans, the infection rates may be understated in the UK, France and Sweden.
-
Among the EaP states the infection rates in Georgia and especially Ukraine may be seriously underreported.
-
Overall the low rates of testing in the EaP and Balkan groups suggest an under-representation of infections.
On the other hand these biases are presumably not reflected in the more statistically robust death rates, although there are some reports of misclassification of Covid-19 fatalities as ordinary pneumonia or flu, notably according to reputed independent sources in Russia, but on this there are no hard data.
Hospital capacity
Data is available on the quantity of hospital beds per head of population (Table 2), which is a useful but only partial indicator of hospital capacity, since data on the quality and adequacy of key technologies such as ventilators are not available for international comparisons. With this reservation, the highest quantities of beds per capita are found in the range of 8 or more per thousand population Germany, Russia, Ukraine and Belarus, twice as high as for China (4.2). The seven West European states average 4.7, similar to many Eastern and Balkan states. However both Italy and Spain have notably less beds at 3.4 and 3.0 per thousand respectively, which would explain part of the extreme tensions their health systems have been experiencing. But lower still are the bed rates in the UK and US (2.8, 2.9), which in the UK case has resulted in the emergency conversion of huge conference centres into temporary Covid-19 hospitals. Georgia and Albania also stand out with similarly low beds rates (2.8, 2.9)
Time paths
Of great importance in comparing the results so far are the differences in ‘starting dates’, here defined as the take-off point when infection rates began to exhibit significant quantities and exponential growth.
For China this was 22 January. Italy followed one month later. The rest of Western Europe followed on average roughly two further weeks later (Italy + 2). Both the EaP and Balkan groups of states followed on average with a further two weeks later (Italy +4), with Russia almost the same. The US finds itself in the middle with about 3 weeks behind (Italy +3).
The time path data in Table 3 thus sets the scene for contemplating what may follow now for those countries that lag behind Italy. The scales differ greatly, but the common message is that the vicious volumes of exponential increase in infections take place in weeks 3 and 4 after take-off, while in the weeks 5 and 6 there can be a flattening of the curve moving towards a stop in new cases.
The EaP and Balkan states now enter this big danger zone. The scale of what to expect however is quite wide. In weeks 3 and 4 in the sample of states in Table 3, Sweden’s infected number grew only 4 times, and that of Belgium 8 times; for Italy the multiple was 9, and for the US it was 22. On the basis of these experiences one might expect the EaP and Balkan states to experience in the next two weeks rises in infection rates by order of 5 to 10 times.
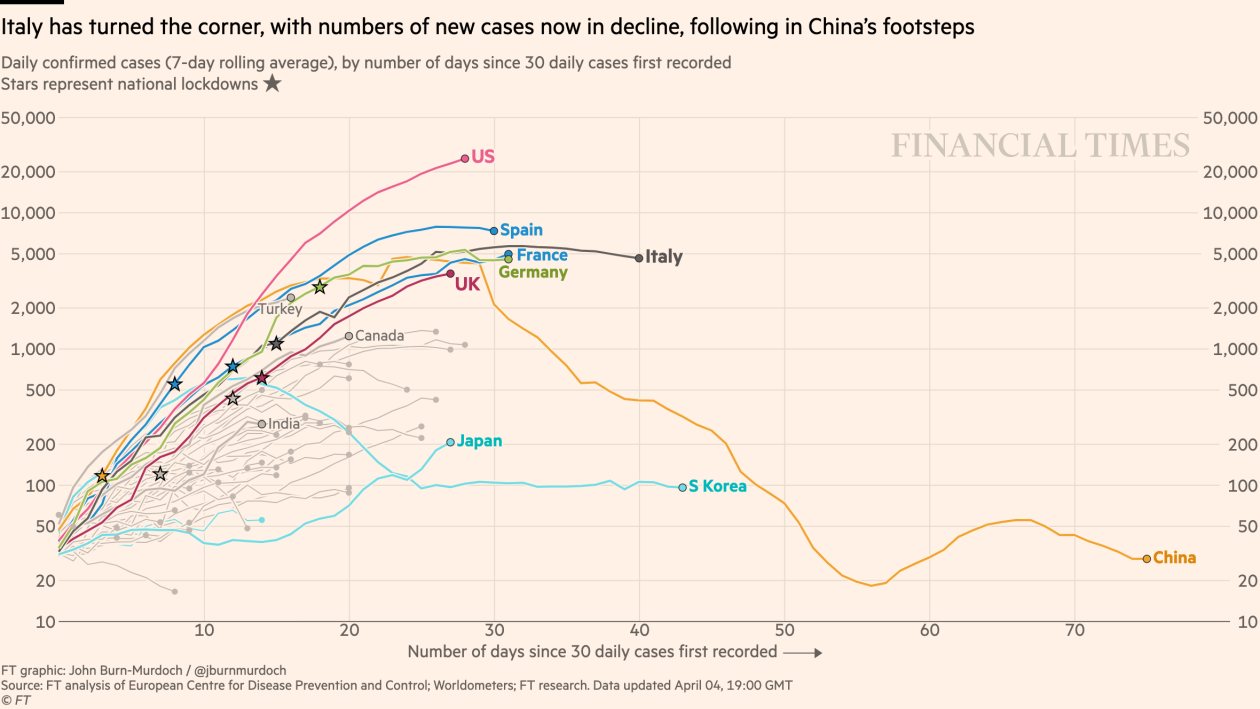
Overall China took one month for the rate of infections to peak and begin to decline (curves in the graph of the Financial Times). For Italy the cycle peaked at 40 days, without much decline yet. The US and UK are still rising strongly after almost one month.
Table 1: Covid-19 recorded infections
|
Cases of infection, 29.3.20 |
Cases of infection, 5.4.20 |
Increase in last week, 29.3-5.4, N times |
Number of infections per capita pop. 5.4.20 |
Take-off date |
|
|
China |
81,149 |
82,543 |
1.01 |
16,758 |
24/1 |
|
US |
123,726 |
308,850 |
3.30 |
1,052 |
16/3 |
|
Russia |
1,246 |
4,731 |
3.80 |
30,754 |
20/3 |
|
Italy |
92,472 |
124,632 |
1.35 |
486 |
21/2 |
|
Spain |
73,235 |
126,168 |
1.72 |
370 |
7/3 |
|
France |
37,575 |
90,848 |
2.41 |
740 |
6/3 |
|
Germany |
57,685 |
96,092 |
1.66 |
861 |
5/3 |
|
UK |
17,089 |
42,477 |
2.49 |
1,553 |
13/3 |
|
Belgium |
9,134 |
18,431 |
2.02 |
613 |
5/3 |
|
Sweden |
3,442 |
6,443 |
1.87 |
1,567 |
6/3 |
E7 |
290,632 |
505,091 |
1.93 |
682 |
7/3 (without Italy) |
|
Georgia |
90 |
170 |
1.89 |
21,764 |
17/3 |
|
Moldova |
231 |
752 |
3.26 |
3,989 |
26/3 |
|
Ukraine |
418 |
1,225 |
2.93 |
34,612 |
23/3 |
|
Belarus |
94 |
440 |
4.68 |
21,590 |
29/3 |
|
Armenia |
424 |
770 |
1.81 |
3,896 |
17/3 |
|
Azerbaijan |
182 |
521 |
2.86 |
19,002 |
24/3 |
EaP 6 |
1,439 |
3,878 |
2.90 |
18,437 |
22/3 |
|
Bosnia |
278 |
624 |
2.24 |
5,288 |
18/3 |
|
Serbia |
659 |
1,624 |
2.46 |
4,310 |
18/3 |
|
Montenegro |
84 |
203 |
2.41 |
2,955 |
24/3 |
|
N.Macedonia |
241 |
483 |
2.00 |
4,347 |
18/3 |
|
Albania |
197 |
333 |
1.69 |
8,708 |
22/3 |
Balkan 5 |
1,459 |
3,267 |
2.16 |
6,121 |
22/3 |
|
Turkey |
7,402 |
23,727 |
3.21 |
3,552 |
18/3 |
Source: John Hopkins University
Table 2: Deaths from Covid-19 and numbers of hospital beds
|
Deaths 29.3.20 |
Deaths 5.4.20 |
Deaths 5.4.20, per 100k population |
Hospital beds per 1000 population |
Population, millions |
Tests, per million |
|
|
China |
3,300 |
3,330 |
0.24 |
4.2 |
1.383.3 |
n.a. |
|
US |
2,229 |
8,407 |
2.57 |
2.9 |
325.0 |
5,355 |
|
Russia |
4 |
43 |
0.03 |
8.2 |
144.5 |
5,194 |
|
Italy |
10,023 |
15,363 |
25.42 |
3.4 |
60.6 |
11,436 |
|
Spain |
5,982 |
11,947 |
25.57 |
3.0 |
46.7 |
7,593 |
|
France |
2,312 |
7,574 |
11.31 |
6.5 |
67.3 |
3,430 |
|
Germany |
433 |
1,444 |
1.74 |
8.3 |
82.8 |
10,982 |
|
UK |
1,109 |
4,320 |
6.50 |
2.8 |
66.0 |
2,880 |
|
Belgium |
353 |
1,283 |
11.23 |
6.2 |
11.3 |
6,040 |
|
Sweden |
105 |
373 |
3.66 |
2.8 |
10.1 |
3,654 |
E7 |
20,317 |
42,304 |
12.20 |
4.7 |
344.8 |
6,573 |
|
Georgia |
0 |
1 |
0.02 |
2.6 |
3.7 |
692 |
|
Moldova |
2 |
12 |
0.34 |
5.8 |
3.0 |
n.a. |
|
Ukraine |
9 |
32 |
0.07 |
8.8 |
42.4 |
134 |
|
Belarus |
0 |
5 |
0.05 |
11.0 |
9.5 |
4,233 |
|
Armenia |
3 |
7 |
0.24 |
4.2 |
3.0 |
1,683 |
|
Azerbaijan |
4 |
5 |
0.05 |
4.7 |
9.9 |
3,945 |
EaP 6 |
18 |
62 |
0.13 |
6.2 |
71.5 |
2,137 |
|
Bosnia |
6 |
21 |
0.63 |
3.5 |
3.3 |
1,809 |
|
Serbia |
5 |
44 |
0.27 |
5.7 |
7.0 |
842 |
|
Montenegro |
1 |
2 |
0.12 |
4.0 |
0.6 |
2,600 |
|
N. Macedonia |
6 |
17 |
0.82 |
4.4 |
2.1 |
2,540 |
|
Albania |
10 |
20 |
0.70 |
2.9 |
2.9 |
833 |
Balkan 5 |
28 |
104 |
0.51 |
4.1 |
20.0 |
1,724 |
|
Turkey |
108 |
501 |
0.61 |
2.7 |
84.3 |
2,151 |
Source: John Hopkins University and World Bank, Worldmeters.info
Table 3: Selected dynamics, number of infected cases
|
Take-off |
+ 2 weeks |
+ 4 weeks |
+ 6 weeks |
|
|
China |
22 January 548 |
34,100 |
75,000 |
82,400 |
|
Italy |
23 February 155 |
5,900 |
53,000 |
124,000 |
|
US |
5 March 217 |
13,700 |
308,543 |
|
|
Belgium |
5 March 109 |
2,300 |
18,400 |
|
|
Sweden |
6 March 101 |
1,600 |
6,443 |
|
|
Moldova |
18 March 109 |
423 |
||
|
Serbia |
19 March 103 |
505 |
||
|
Ukraine |
24 March 100 |
1,225 |
Source: derived from John Hopkins University